





Sustainability dashboards & analytics that generate portfolio insights
Put every sustainability KPI in context with interactive dashboards, peer benchmarks and AI-generated insights. Analyse performance by fund or portfolio company, track your targets and share clear factsheets in one click.











Sustainability dashboards that make your data speak

Performance monitoring

Campaign follow-up

Indicators

Scoring & targets
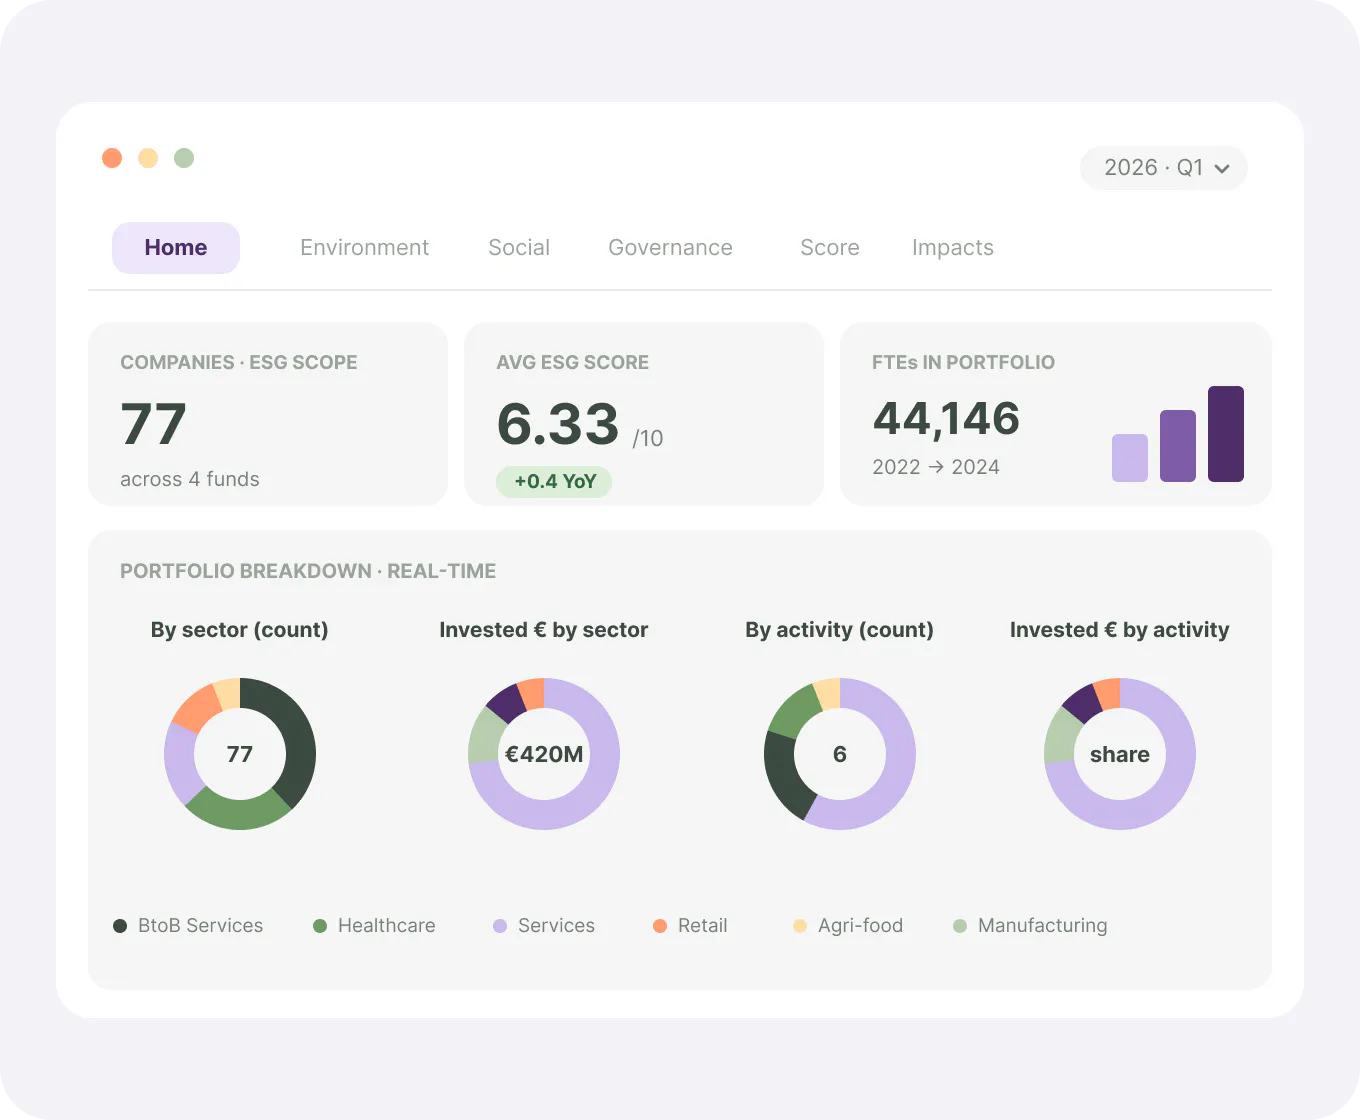
Performance by fund and portfolio company
Mirror your organisation. Build interactive dashboards by fund, portfolio company, geography or investment strategy
From one company to the full portfolio. Analyse performance at entity level, then consolidate it up to the fund and the whole portfolio
See weak signals early. Spot progress, gaps and abnormal variations across your holdings before your next investor review
Sustainability factsheets in one click
Factsheet customization
Communicate factsheets
Enriched content
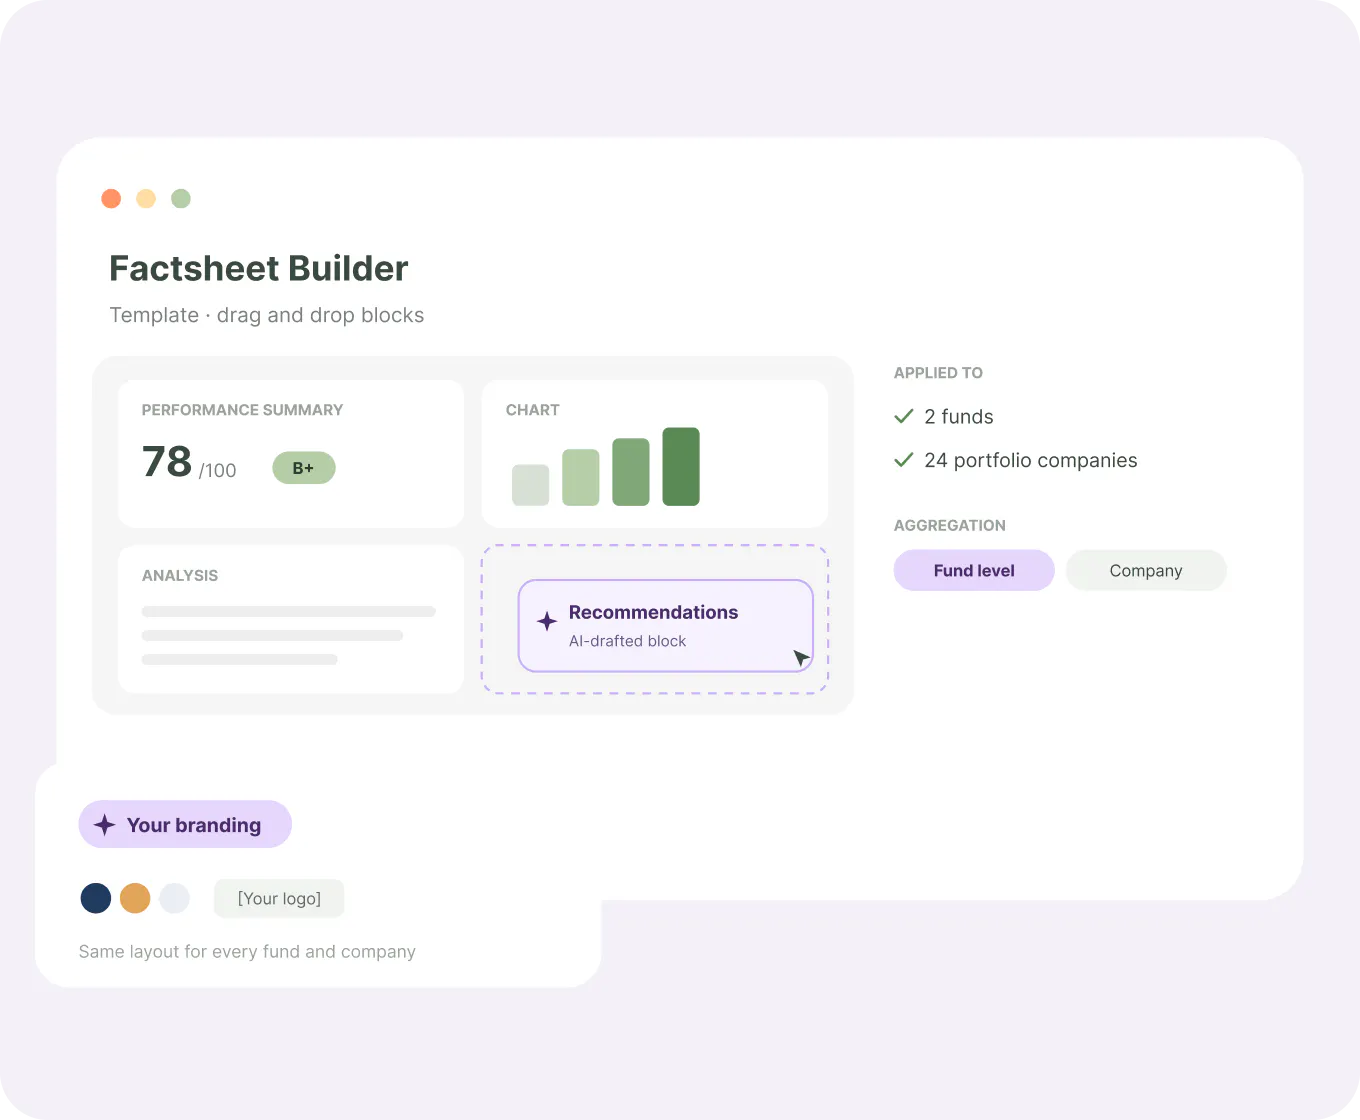
Build fund and portfolio company factsheets, block by block
A template organised in blocks. Start from a factsheet layout and drag and drop what each block shows: a performance summary here, a chart there, an analysis of the fund with recommendations, and more
One structure, every entity. Choose the indicators and aggregation level once. Every fund and portfolio company gets the same layout, with your branding
Sustainability analytics for every stage of the investment lifecycle

Fundraising
Bring sustainability narratives, factsheets and investor-ready exports to your fundraising materials.
Investment committee
Give deal teams and committees one structured view of each target: scoring, benchmarks, risks and key insights.

Holding period
Track portfolio performance, prepare board meetings and LP reports from the same dashboards, and ask GreenSight AI about trends in plain language. Export in Excel, PDF or PowerPoint.

Exit
Show buyers a consolidated sustainability track record: improvements, carbon gains and regulatory compliance over the holding period.
Greenscope AI
- Ask Greenscope
- Greenscope Agents
- Standard & Advances plans
- Stored & process in EU
GreenSight AI reads reports, PDFs and spreadsheets, extracts the relevant KPIs and pre-fills questionnaires, with a confidence score on every suggestion you validate. It also reviews thousands of data points in minutes to flag abnormal variations, inconsistencies and missing data, with an explanation for each alert.
Explore the platform behind your sustainability dashboards
Sustainability Data Management
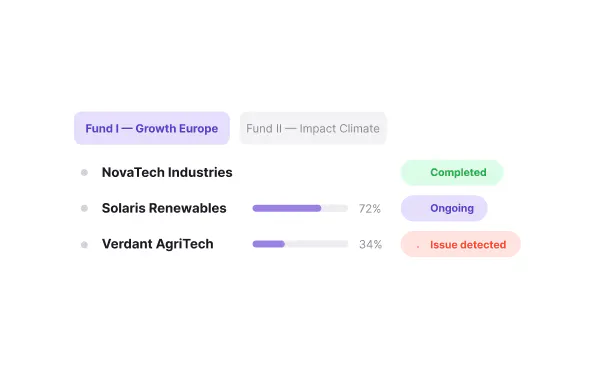
Consolidate and monitor your data across funds and portfolio companies
Scoring & Benchmark
Benchmark sustainability performance with configurable scoring models and +10 000 companies

GHG & Financed Emissions
Measure Scope 1, 2 and 3 and financed emissions, aligned with PCAF
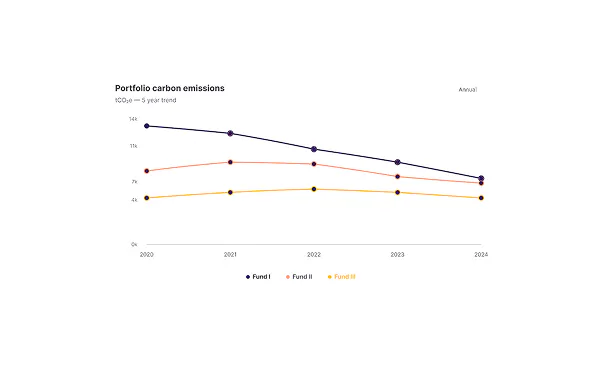
Dashboards & Analytics
Track performance in customisable real-time dashboards
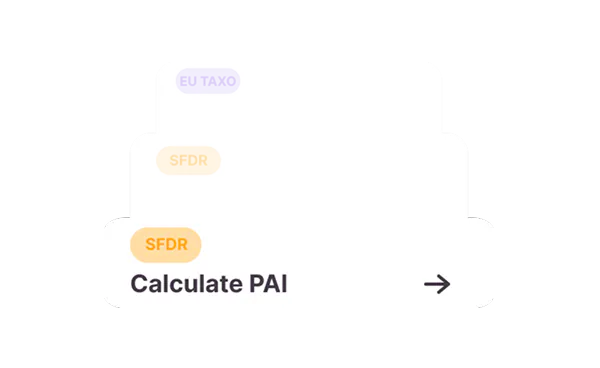
Regulation & Disclosures
Prepare SFDR, PAI and other disclosures with full traceability
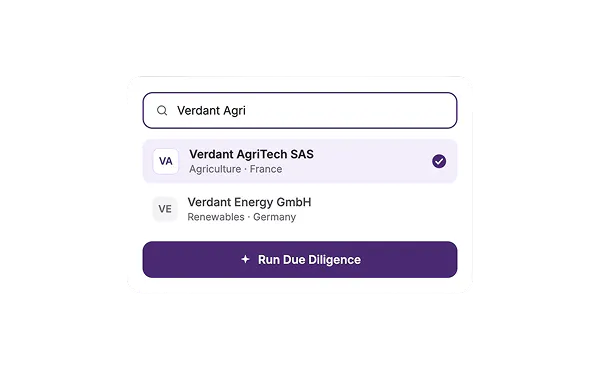
Sustainability Due Diligence
Assess risks, controversies and opportunities before you invest
LP Request
Reuse sustainability data instantly to answer LP requests
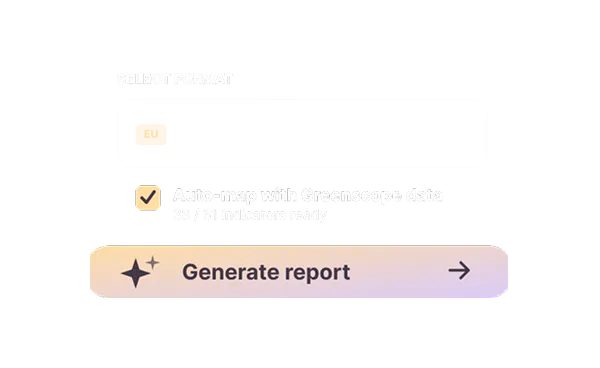
Greensight AI
Ask the AI assistant about your data, and activate expert sustainability agents to do the work

Their words, not ours

How Greenscope supported Siparex across the entire ESG function

Montefiore chose Greenscope to help writing their ESG report

How Quilvest Capital Partners uses Greenscope to optimize the management of its ESG data

Turenne Group: making ESG data speak across 300 portfolio companies

“We chose Greenscope to grow, and we made the right choice”
Simon Ruchaud
Products & Sustainability Director
Greenscope numbers
+100
clients using the platform
700
funds on the platform
$1.5trn
assets monitored
+10k
companies reporting with us
Latest sustainability insights for investors
ESG News - August 2026
Discover key developments: ongoing projects, standards updates, new official documents.

How Zencap AM industrializes ESG across its private debt strategies with Greenscope
ESG data collection, PAIs, the EET and carbon: how Zencap AM makes its reporting reliable at scale.
ESG News - April 2026
Discover key developments: ongoing projects, standards updates, new official documents.
ESG Dashboard: FAQ
What should a sustainability dashboard for a fund show?
A sustainability dashboard, or ESG dashboard, should cover five views: data collection progress across portfolio companies, carbon intensity, SFDR PAI indicators, score trends against peers, and progress against your targets. Each view should work at portfolio company, fund and portfolio level.

Can we build dashboards per fund or portfolio company?
Yes. Dashboards can be built by fund, portfolio company, geography or investment strategy, and consolidated from a single entity up to your full portfolio. You configure them yourself or with our specialists.
Which export formats are available?
Dashboards and reports export to Excel, PDF and PowerPoint, ready for LP reporting, board meetings and fundraising materials.
Can LPs or auditors access the data?
You share dashboards and factsheets with LPs through exports, or answer their requests directly in the platform. Every figure links back to its source data and supporting files, with a full audit trail.
How are sustainability factsheets generated?
From automated templates, per fund or per portfolio company. You choose the indicators and aggregation level once, and each factsheet is generated in seconds from platform data.
How are sustainability factsheets generated?
From automated templates, per fund or per portfolio company. You choose the indicators and aggregation level once, and each factsheet is generated in seconds from platform data.
How often is dashboard data updated?
Dashboards read platform data live: a figure appears as soon as it is submitted and validated.